Services: The New Software $T Company Transformation · Technology · Trillion-scale
hello@itmagix.com LinkedIn
Automate · BI & Dashboards

Turn business data into decision views people can trust and use.

ITMagix connects KPI definitions, data models, dashboard design and operating workflows so executives and teams can see what changed, why it matters and where attention is required.
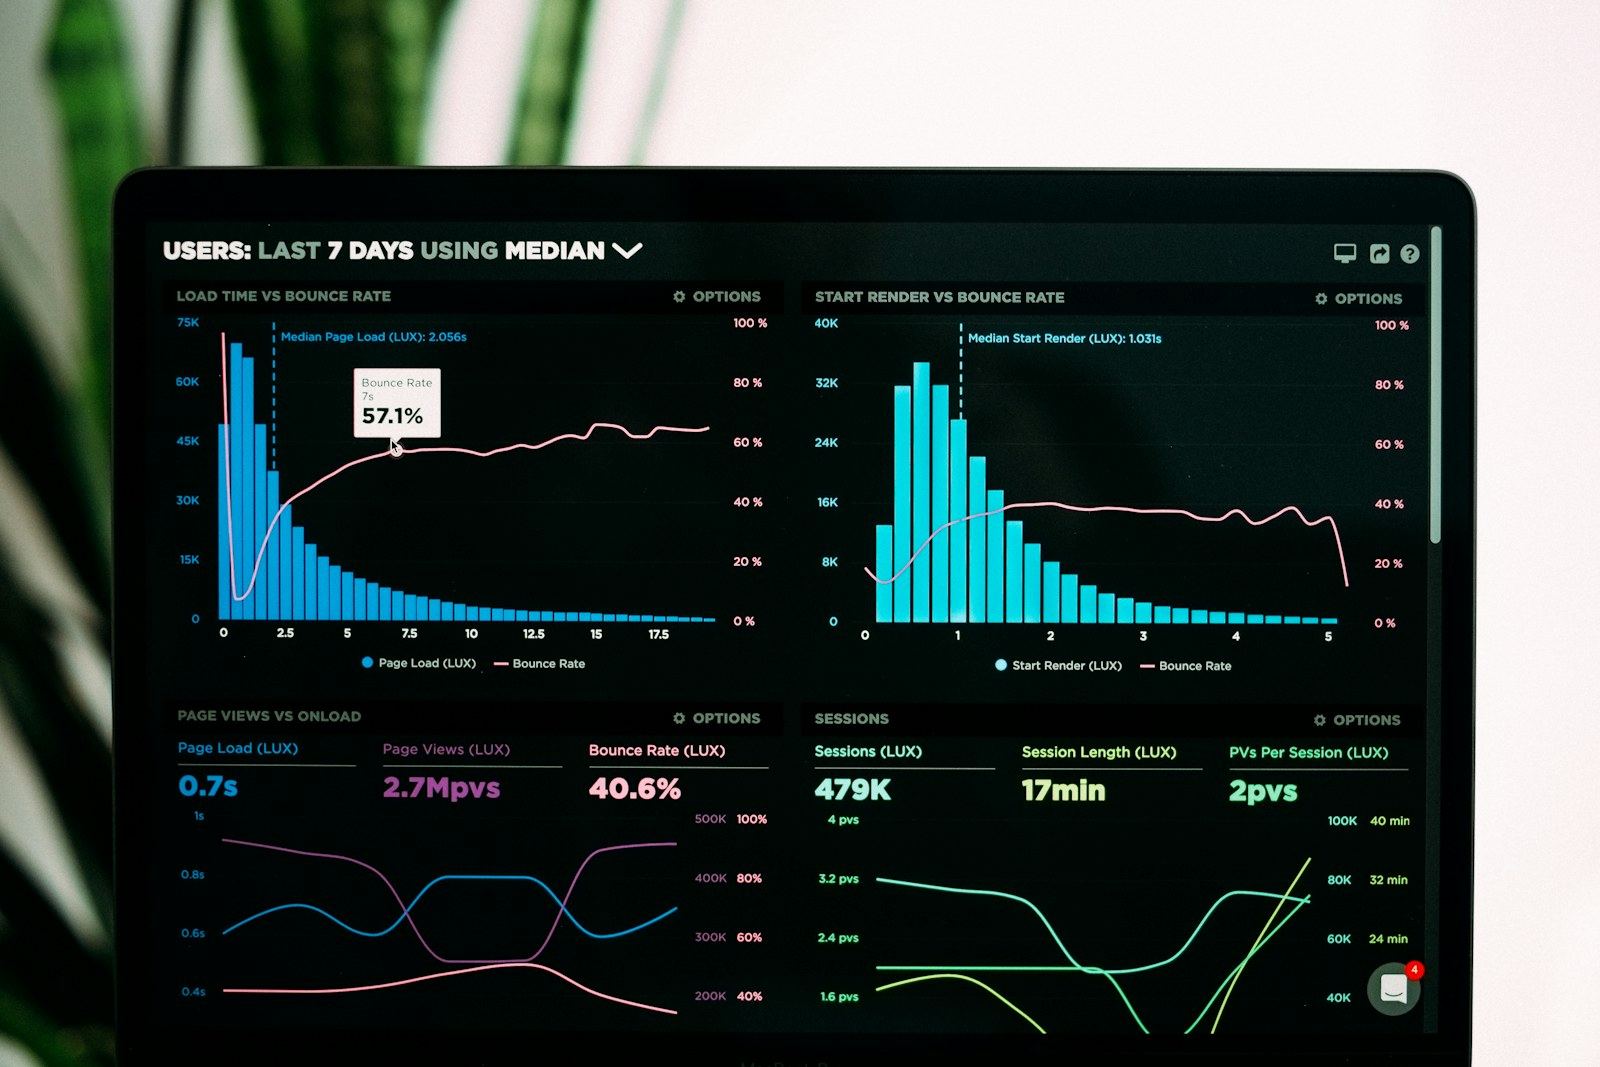
Business intelligence dashboard and performance analytics
DECISION VIEWRevenue↗Margin→Capacity↘Risk
THE QUESTIONCan the person looking at the dashboard tell what changed and what action follows?
Decision Latency

Reporting becomes a problem when the answer arrives after the decision.

BI should shorten the distance between a business event and the people responsible for responding to it—without forcing teams to reconcile reports before they can act.

Too many reports

Teams hunt across files, dashboards and recurring exports to answer the same operating question.

Conflicting KPIs

Definitions vary by department, tool or analyst, creating debate before the real decision even starts.

No decision context

A metric changes, but the view does not explain the driver, owner, threshold or action that should follow.

Business performance reporting and decision latency
BI QUESTIONWhat should the viewer understand or do within 30 seconds?
KPI Model

Build the metric hierarchy before designing the dashboard.

Good BI separates strategic outcomes from operational drivers and diagnostic detail.

OUTCOMEAre we achieving the business result?
DRIVERWhat is moving the outcome?
OPERATING SIGNALWhere should a team investigate?
DIAGNOSTIC DETAILWhat explains the change?
Dashboard Experience

Design dashboards around the decision flow, not around the chart library.

Different users need different levels of context, speed and detail.

Executive business intelligence dashboard
EXECUTIVE

Outcome, trend, exception.

One view for what changed and where leadership attention belongs.

OPERATIONS

Work queues and drivers

Views tied to team actions, thresholds and near-term decisions.

ANALYTIC

Explore and diagnose

More dimensions, filters and detail for investigation.

MOBILE / ALERT

Act on the exception

Concise signals when the user is not sitting inside a dashboard.

Data model and semantic layer supporting BI
SEMANTIC LAYEROne business definition should survive across dashboards, exports and AI-assisted analysis.
Semantic Model

Put business definitions between raw data and the dashboard.

The semantic layer gives measures, dimensions, hierarchies and access rules a consistent home.

Shared measuresConformed dimensionsTime logicAccess rulesReusable calculations
Adoption Loop

A dashboard is only valuable if it becomes part of the operating rhythm.

Embed BI into weekly reviews, exception management and recurring decision cadences so usage is tied to work.

SEEMetric changes
→
UNDERSTANDDriver and context
→
ACTOwner and response
→
LEARNOutcome and adjustment
Business Outcomes

The best BI system reduces debate about the number and increases discussion about the action.

Trusted definitions and decision-oriented views make performance conversations faster and more consistent.

Faster management visibilityShared KPI definitionsLess manual reporting effortBetter exception-driven decisions
ITMagix Service Model

Build · Transform · Automate · Operate.

Automate connects intelligence, data and workflow design to the software and operating environments around it.

Automate with ITMagix

Have an automation decision that needs a practical path forward?

Bring the process, data, decision or operating constraint. ITMagix can help define where automation fits, what has to be ready first and how to move from idea to production.


START HEREStart with the work that needs to change—not the tool.Discuss Your BI & Dashboard Requirement